Water Quality Monitoring


Why is water quality monitoring important?
Regular monitoring is a critical step in the development of baseline conditions. Without a strong baseline for any parameter, comparison of data within a single year, between years, or between lakes is not particularly helpful. Additionally, consistent and repeated data collection is essential in determining water quality trends. According to experts at Maine DEP, we need at least 10 years of baseline data before we will meet the minimum data threshold to complete statistical analyses that will identify water quality trends. 3o Mile has collected data for many our lakes and ponds since 2016.
What do we monitor?
Water Clarity
Approximately every two weeks, we record water clarity (a.k.a. secchi disk transparency). This is a quick and simple method used to indirectly assess the concentration of algae in lakes. To measure water clarity, a black and white disk is lowered in the water and the reading is taken at the depth at which it is no longer visible.
Temperature
Approximately every two weeks, we record a temperature profile. Temperature is the measure of heat in the water and can affect the lake’s chemistry and biology. For example, the amount of oxygen water can hold is directly related to the temperature of the water. The higher the temperature, the less dissolved oxygen the water can hold. Oxygen will naturally decline during the summer months as water temperatures rise. Lakes deeper than 25-30 feet can also stratify, with warm water above cooler deep water, restricting circulation in the lake. This can contribute to oxygen loss in the lower waters. Temperature can also control the kinds of plants and animals found in lakes. Certain species of fish, insects and algae will predominate during the cooler temperatures of the spring and fall, yet disappear during the warmer temperatures of summer. For instance, salmonid fish (such as trout and salmon) generally prefer temperatures below 18°C (65°F) but can tolerate slightly higher temperatures for short periods of time. Conversely, other more tolerant species will predominate during the more stressful summer months.
Dissolved Oxygen
Approximately every two weeks, we record a Dissolved oxygen (DO) profile. DO is a critical indicator of the health of the lake system. DO is produced through photosynthesis, consumed during respiration and decomposition, and is influenced by wind, wave action, weather events, and lake productivity. A good supply of oxygen is essential for fish and other aquatic species. As lakes become more biologically productive in the summer, oxygen can decline as decomposition occurs in deep areas of the lake. Loss of oxygen may indicate a stressed and changing ecosystem. Understanding the pattern and extent of oxygen loss in deep areas is particularly important for lakes that may be more vulnerable for internal phosphorus loading due to unique sediment chemistry.
Phosphorus & Chlorophyll
Once per month, 30 Mile collects water samples and analyzes them for phosphorus and chlorophyll concentrations. Phosphorus is the nutrient that most influences the growth of algae in lakes. Phosphorus naturally occurs in soil, but is also found in fertilizers, septic systems, and animal or livestock waste, among other sources throughout a watershed. Chlorophyll is a pigment found in plants and algae. Measuring the concentration of this pigment helps us estimate the algal population in the lake.
Advanced Chemistry Parameters (pH, Alkalinity, True Color, and Conductivity)
Once per season, in the month of August, 30 Mile collects water samples and analyzes them for advanced chemistry parameters.
pH: pH affects the types of plant and animal species that can live in the lake and governs biochemical processes that take place. The pH scale ranges from 0-14, with 7 being neutral. Water is increasingly acidic below 7, and increasingly alkaline above 7. A one unit change in pH represents a tenfold change in acidity or alkalinity. The pH scale is the inverse log of the hydrogen ion concentration.
Alkalinity: Alkalinity is also referred to as “buffering capacity.” It is a measure primarily of naturally available bicarbonate, carbonate, and hydroxide ions in the water and is measured in milligrams per liter (mg/L). Measuring alkalinity is important to determining a lake’s ability to neutralize acidic pollution from rainfall or snowmelt. Lakes with alkalinity values >20 mg/L are considered well buffered against pH changes over time. Lakes with low or zero alkalinity may have more variation in pH levels that can sometimes result in damage to aquatic life.
True Color: Water color refers to the concentration of natural dissolved organic acids. This includes natural tannins and lignins dissolved in the water, often resulting in “tea” or “root beer” colored water in very colored lakes. “True Color” is measured in Platinum Cobalt Units (PCU) after all particulates (including algae cells) have been filtered out of the sample. Colored lakes (>30 PCU) can naturally have reduced transparency readings and increased phosphorus values. However, this does not mean the lakes produce more algae. The color simply reduces the transparency such that the reading is not a good measure of algal biomass. In this case, chlorophyll-a (Chl-a) is the best indicator of algal productivity.
Conductivity: Conductivity measures the ability of water to carry an electrical current and is directly related to the dissolved ions (charged particles) present in water. Fishery biologists can use conductivity values to calculate fish yield estimates because conductivity will increase if there is an increase of pollutants entering a lake or pond. Stormwater runoff from developed areas and roadways is the most common pollutant in Maine lakes that can raise conductivity values. Conductivity is measured in micromhos per centimeter (µMHOS/CM).
A viewscope and secchi disk is used to take a water clarity reading.

Secchi disk
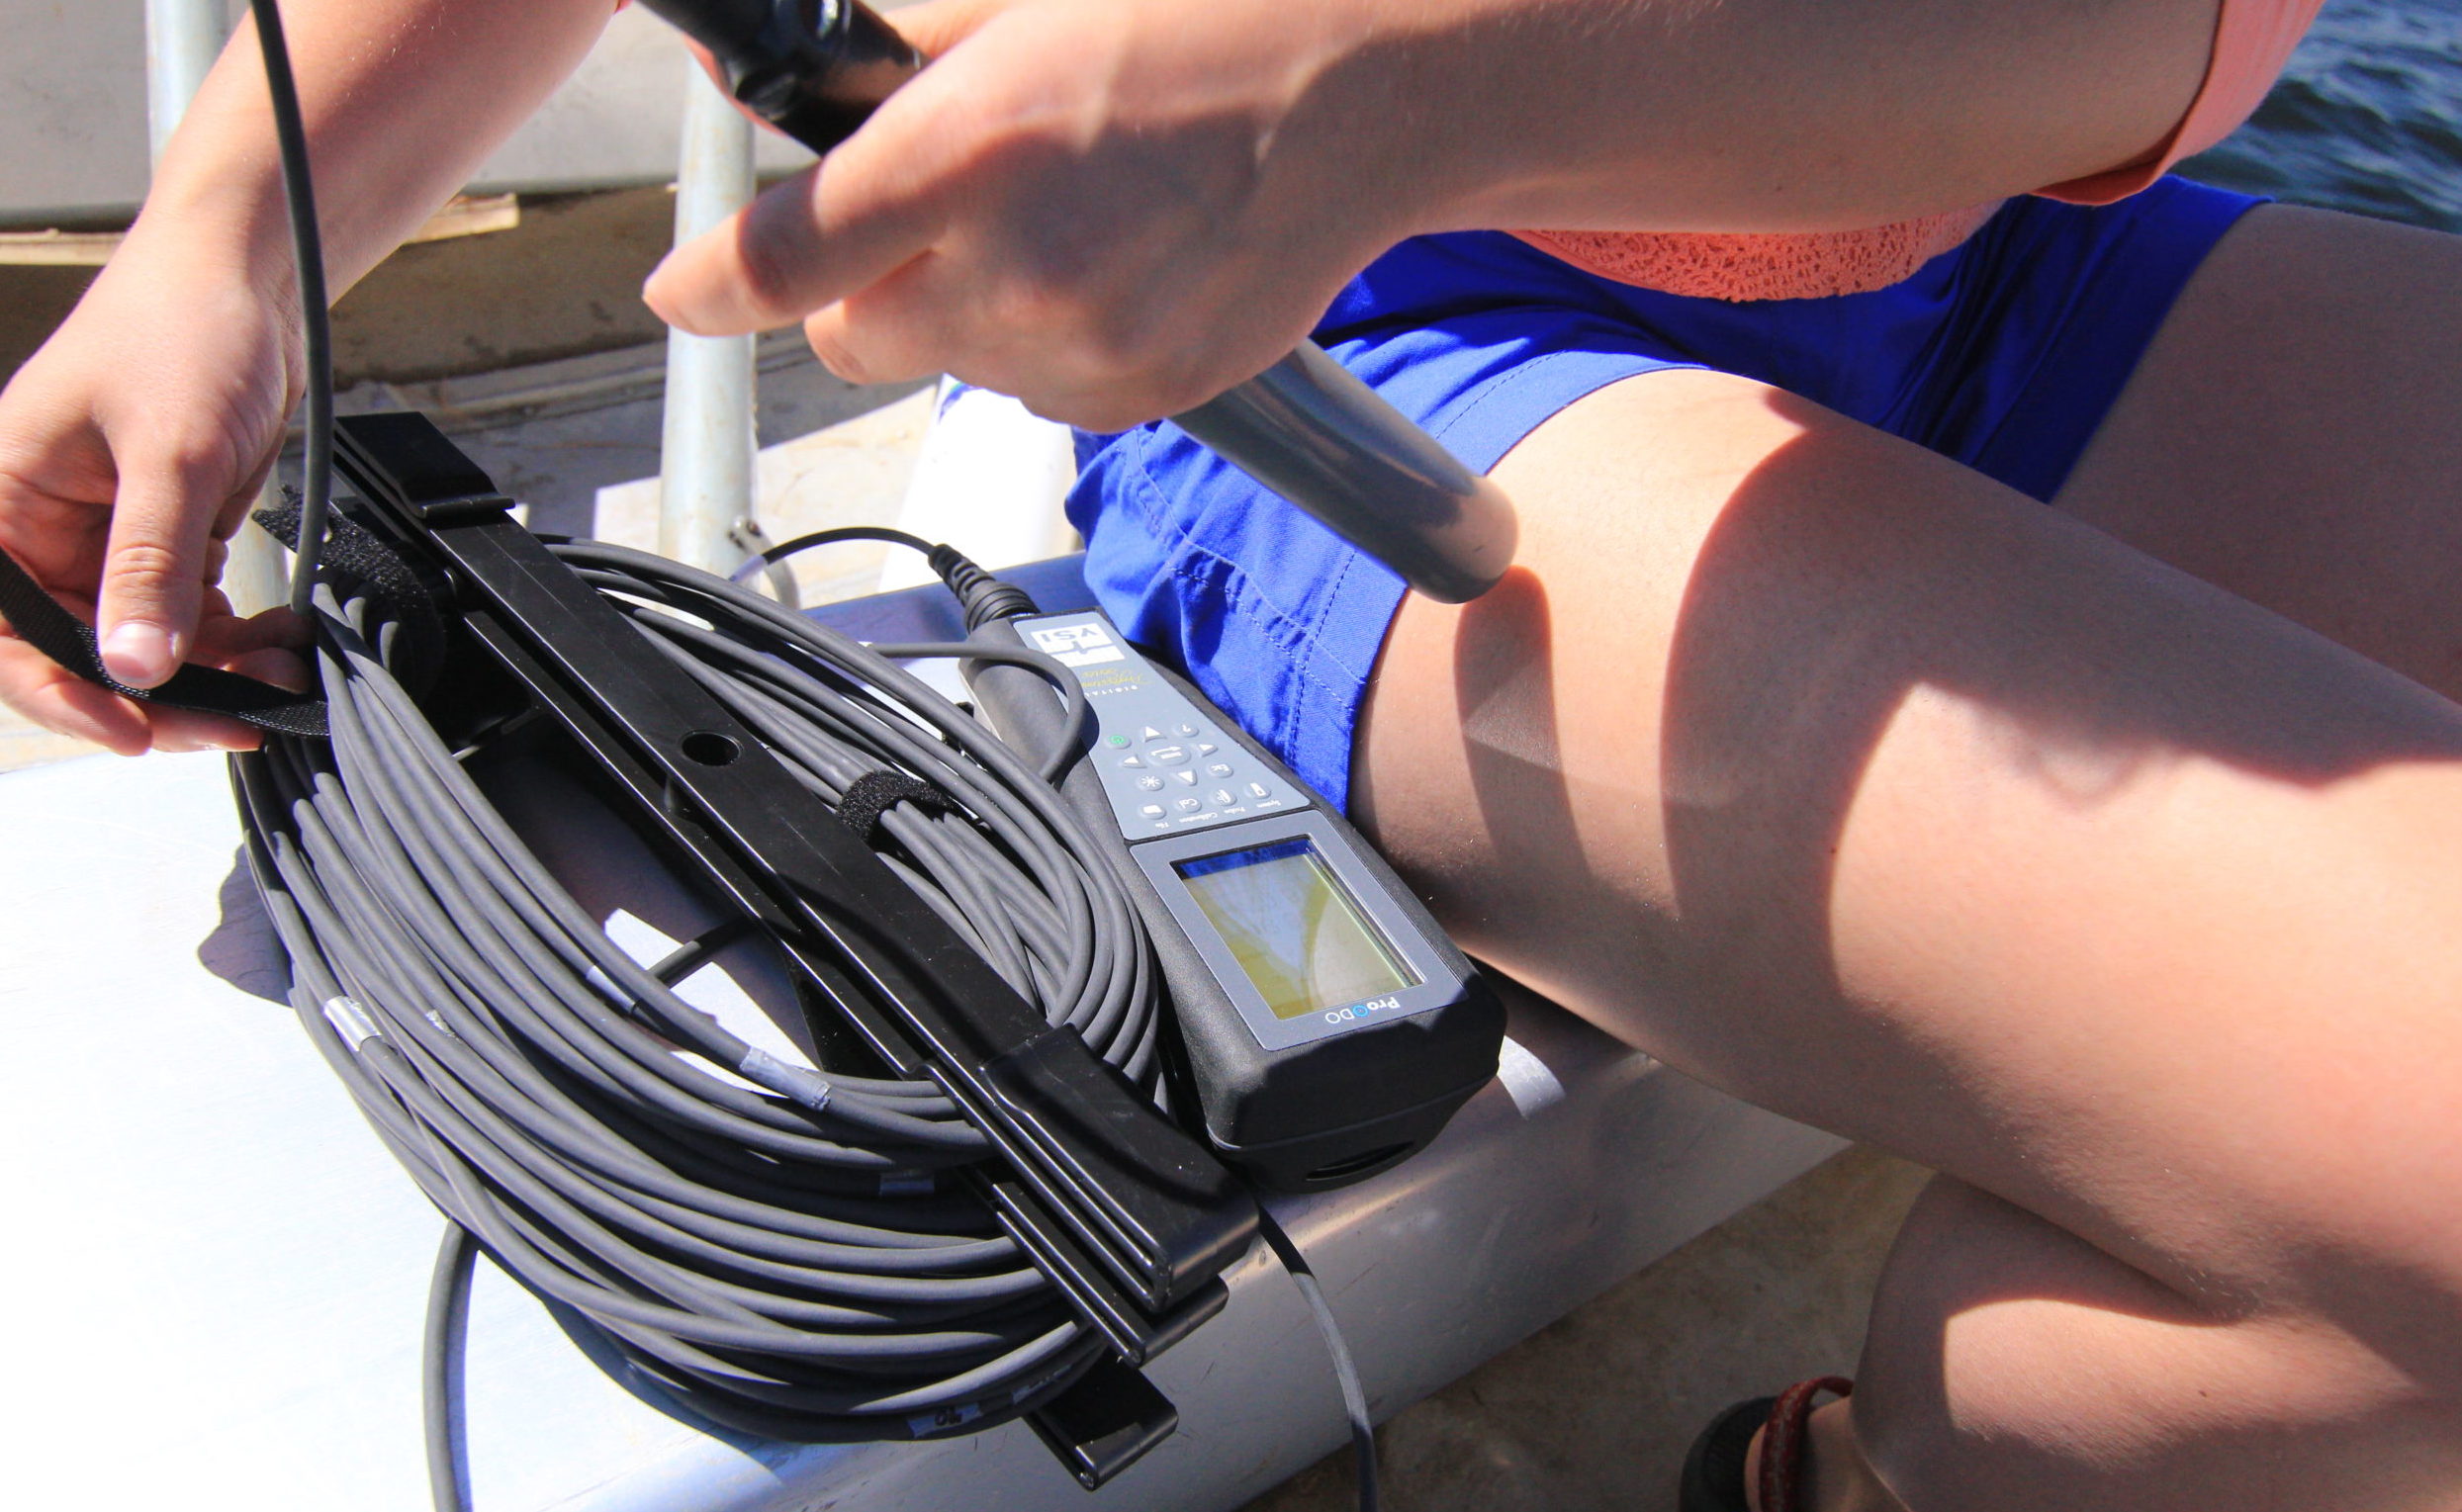
Dissolved oxygen and temperature meter

A Kemmerer is used to collect water samples at specific depths, typically for phosphorus analysis

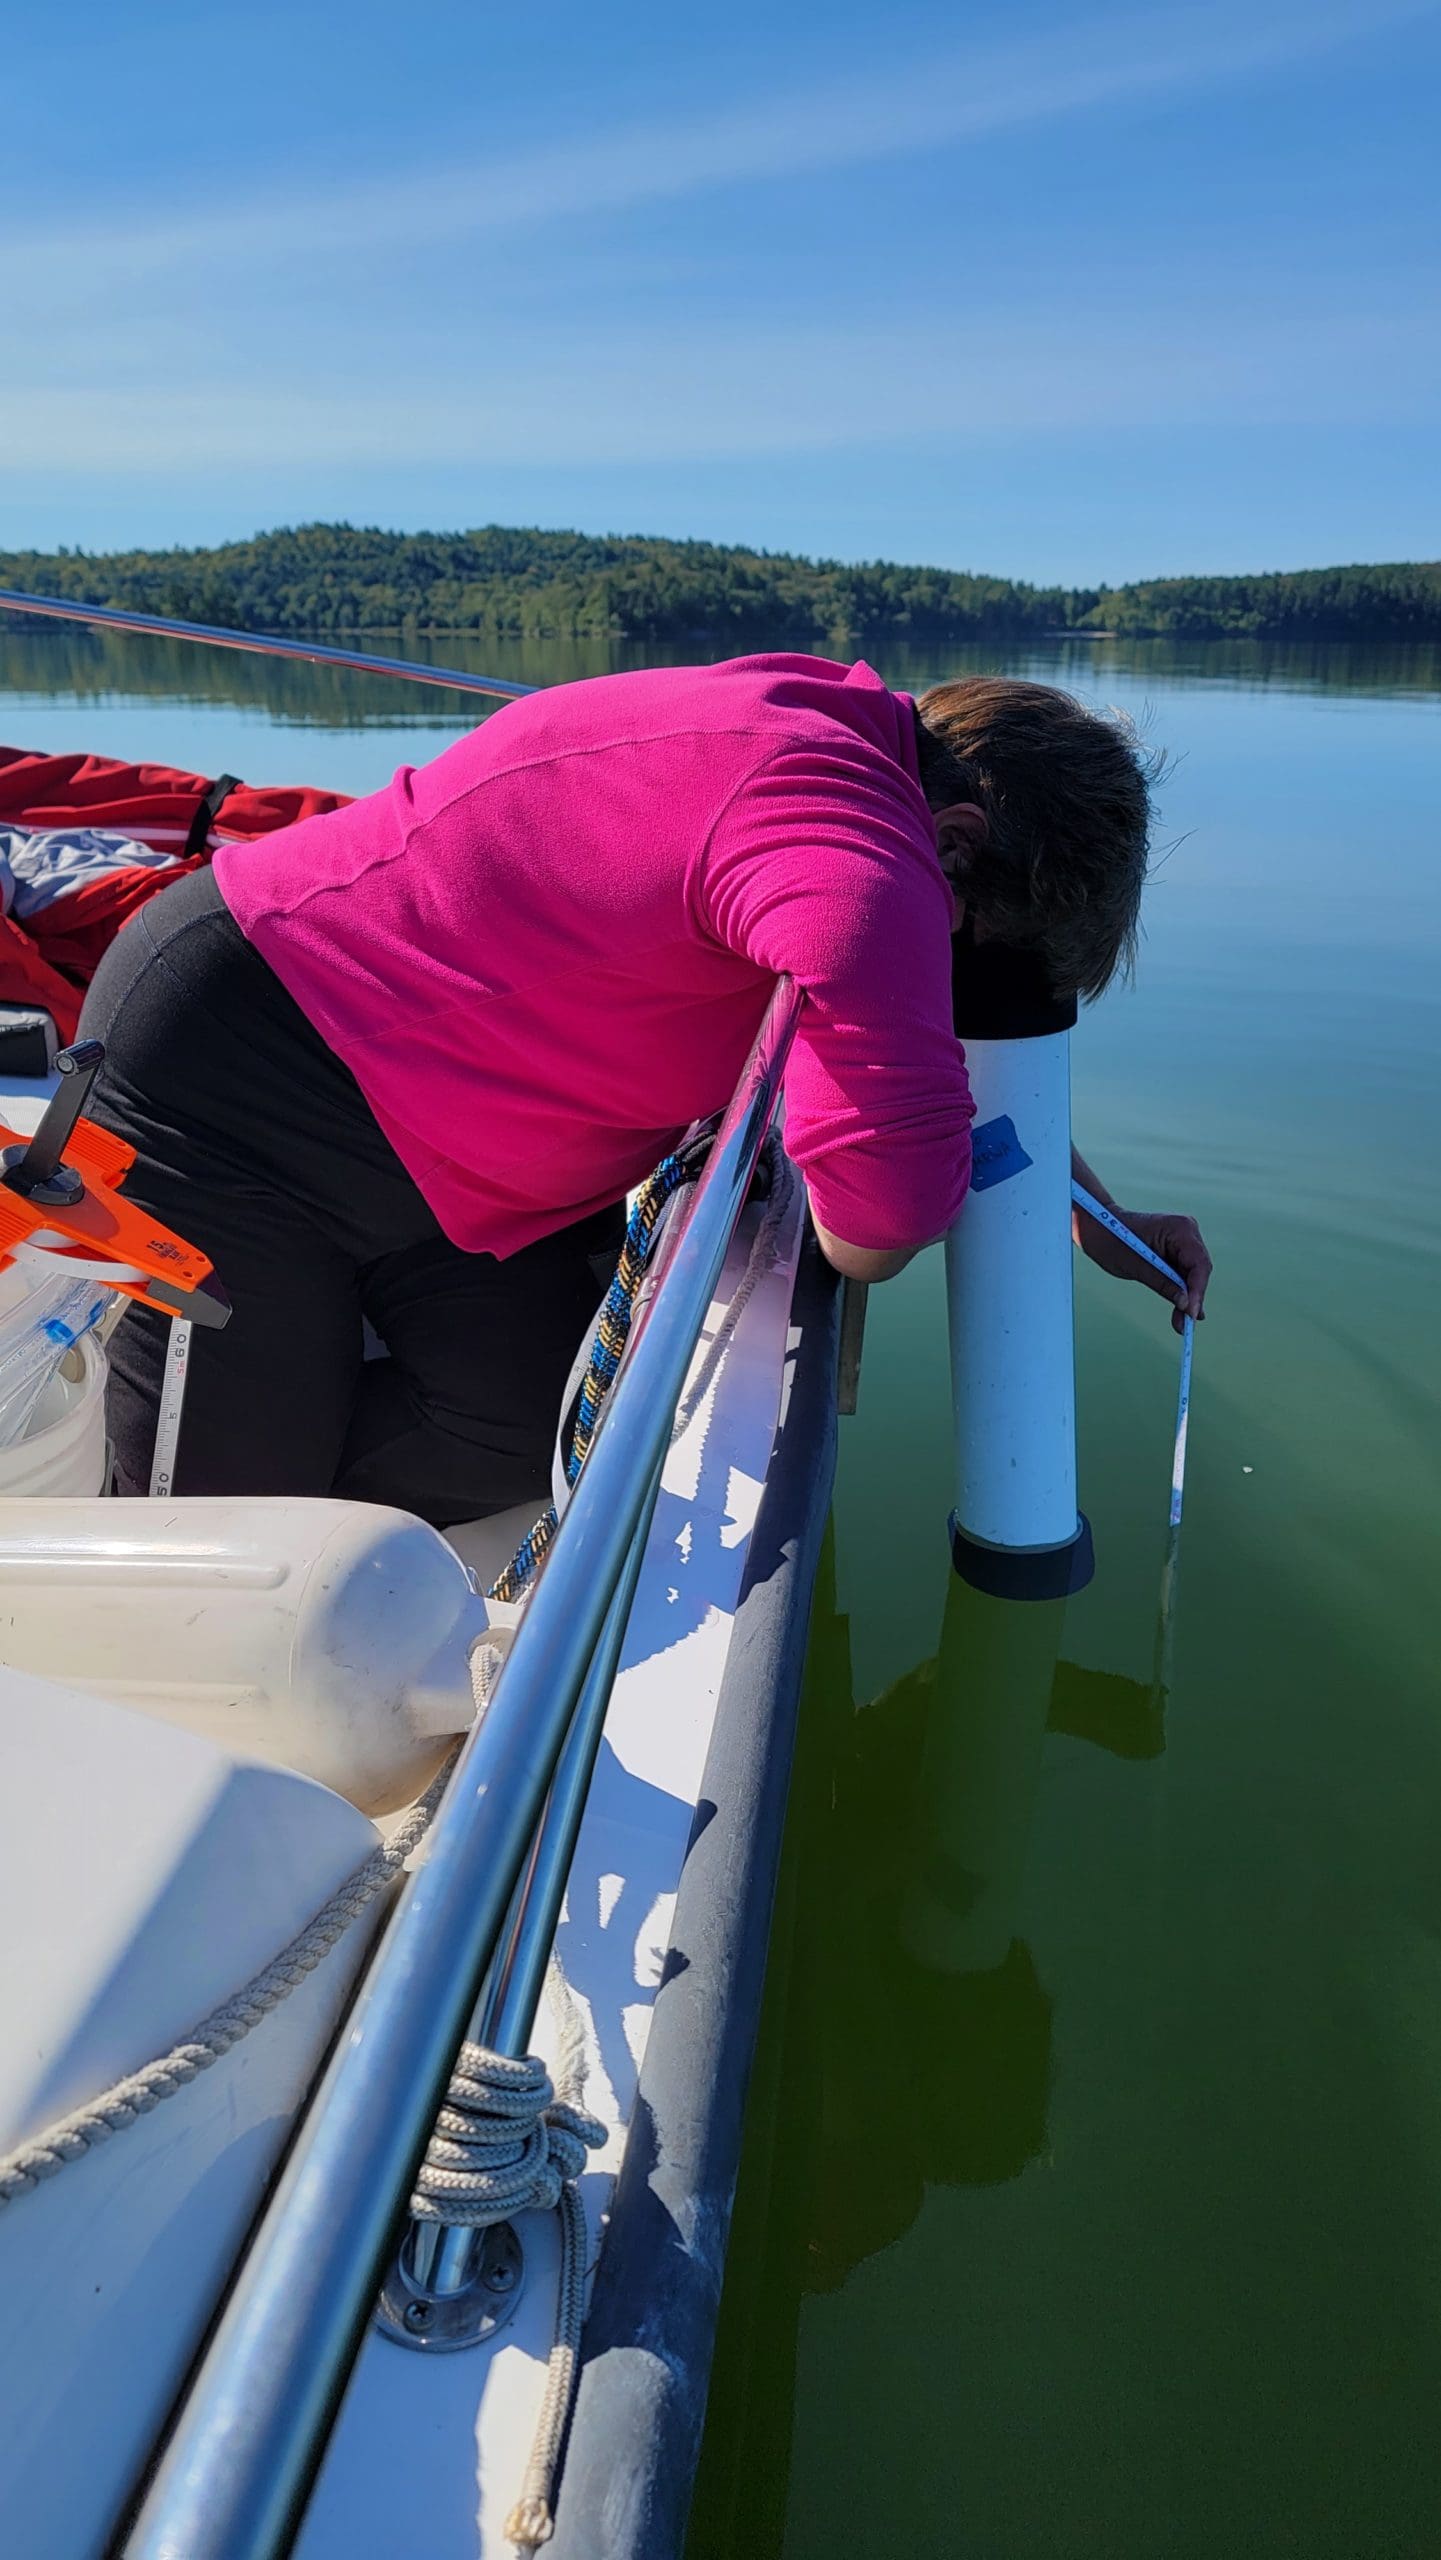
A core tube is used to collect water from the epilimnion (top layer), typically for chlorophyll-a and phosphorus analysis
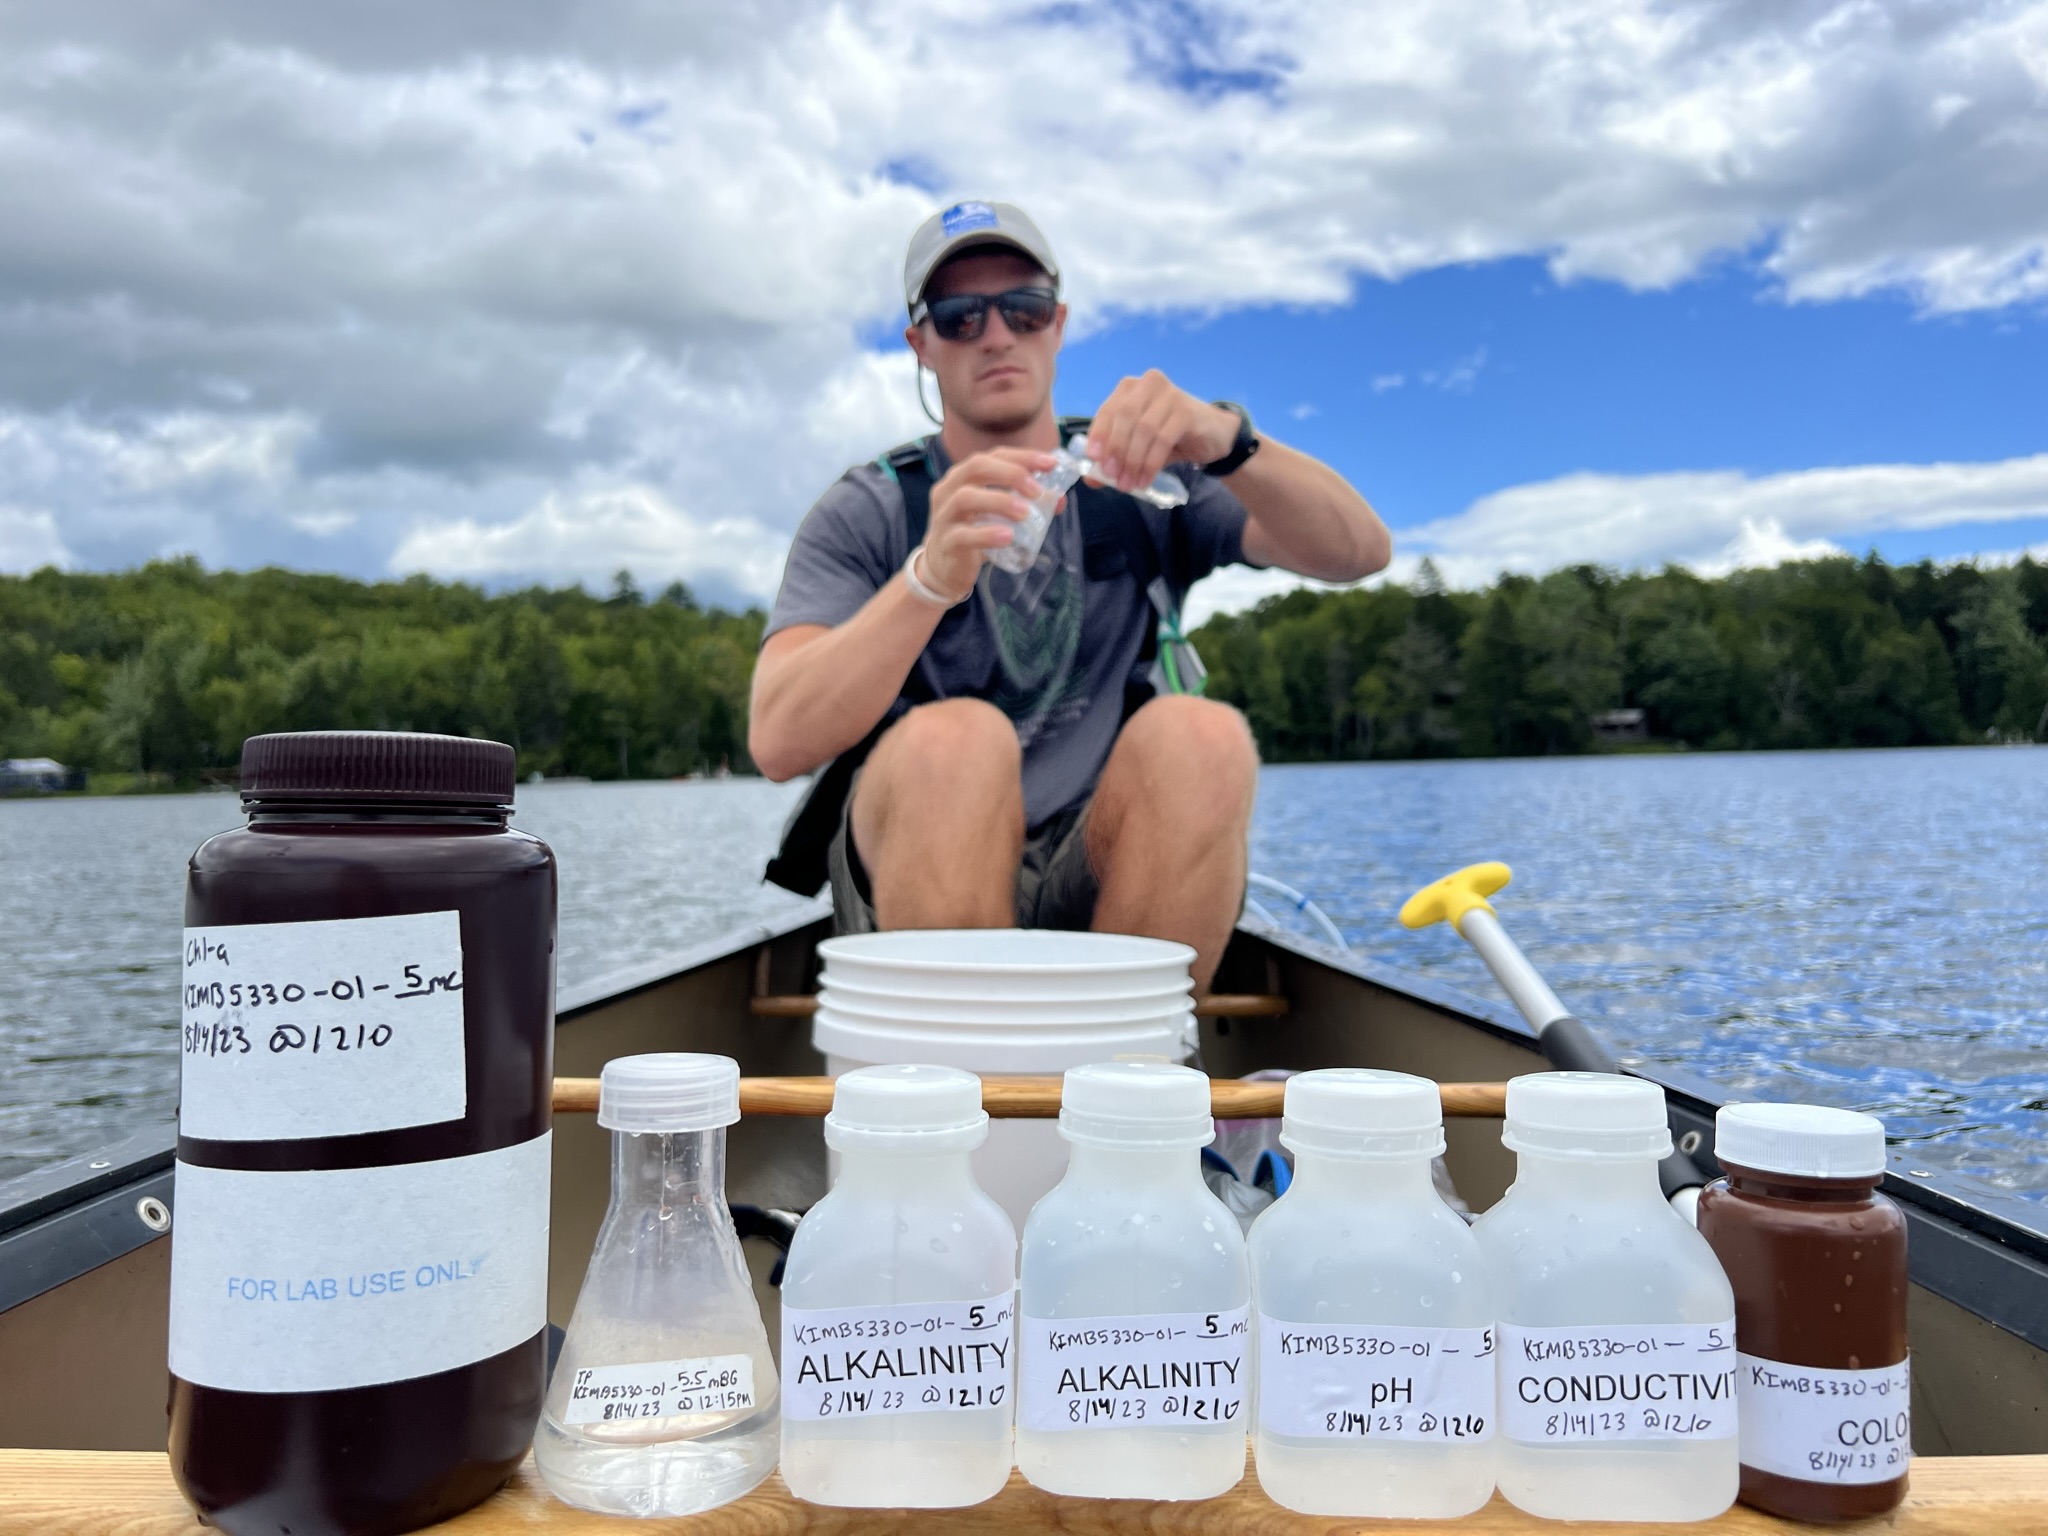
Advanced chemical parameter samples (collected from an epilimnetic core).
")
Where does the data go?
Near real-time data for all lakes in our monitoring program (secchi depth, dissolved oxygen and temperature) can be found by choosing a lake page above.
At the end of each season a comprehensive water quality annual report is generated for each lake summarizing the results, and updating historical data averages. 30 Mile staff and volunteers are trained by Maine DEP, therefore our data is submitted and included with the statewide catalog of lake data, and is used to calculate state-wide trends, inform climate models, and in other lake-related research.
Additional Resources
- University of Maine – “What is that stuff?” Field Guide to Aquatic Phenomenon
- Lake Stewards of Maine – Water Quality Indicators
- Lake of Maine website – www.lakesofmaine.org
Interested in becoming a volunteer water quality monitor?
Contact Sara York, 30 Mile’s Water Quality Specialist at sara@30mileriver.org. You can also read more about becoming a monitor on the Lake Steward’s of Maine training & certifications webpage.
