Hales Pond Water Quality Report | 2025
2025 Water Quality Monitoring Season Snapshot
30 Mile staff and volunteers monitor water quality on lakes and ponds in the watershed. Between May and October, we monitor nine lakes on a bi-weekly schedule, two small ponds three times a season, and two additional small ponds once per season.
On Hales Pond:
Secchi readings
DO & Temp profiles collected
EC’s & BG’s collected
Chlorophyll profiles collected
Advanced Chemistry Parameters
Discussion & Next Steps
Water Quality Monitoring trips completed in 2025
Secchi Disk Transparency (Water Clarity)
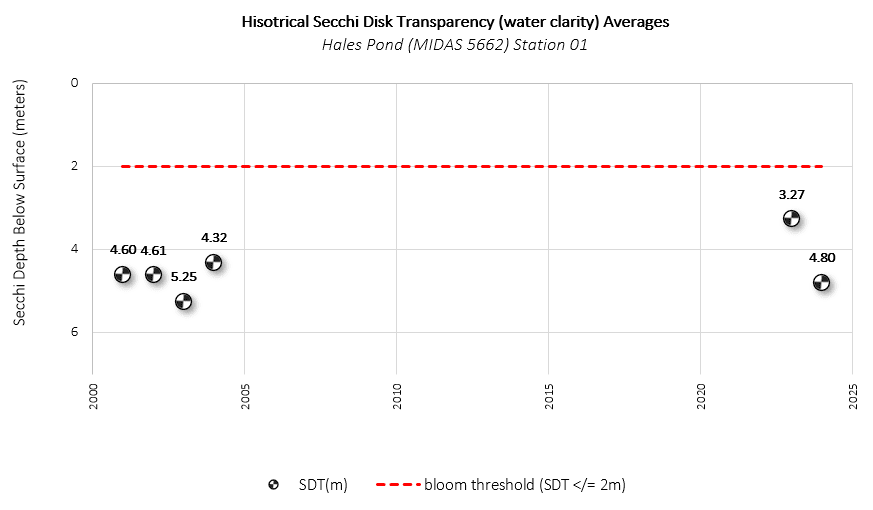
Secchi disk transparency (SDT) is an indicator of water clarity. To measure water clarity, a black and white disk is lowered into the water and the reading is taken at the depth at which it is no longer visible. Factors that affect water clarity include algal growth, zooplankton densities, natural water color, and suspended silt or sediment particles.
2025 average: 3.32 meters (16 feet)
2025 min: 3.32 meters (16 feet)
2025 max: 3.32 meters (16 feet)
Maine Lakes Secchi Average: 4.8 meters (16 feet)
Hales Pond Historical Secchi Average: 4.73 meters (16 feet)
How do we monitor water clarity?
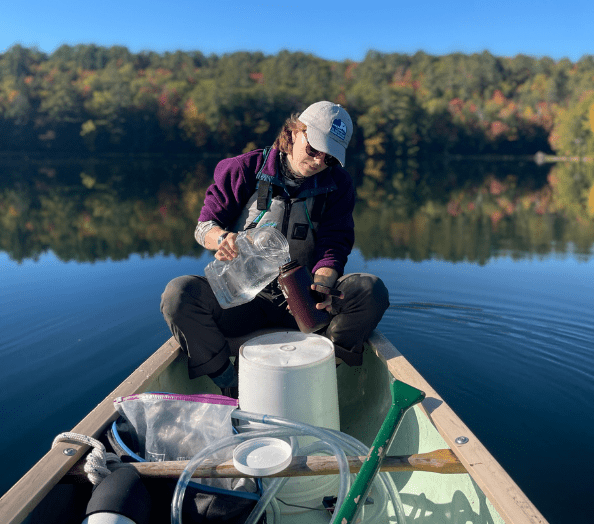
Approximately every two weeks, we record water clarity (a.k.a. secchi disk transparency). This is a quick and simple method used to indirectly assess the concentration of algae in lakes. To measure water clarity, a black and white disk is lowered in the water and the reading is taken at the depth at which it is no longer visible.
Temperature and Dissolved Oxygen (DO)
Temperature readings:
Dissolved Oxygen readings:
How do we monitor temperature?
Approximately every two weeks, we record a temperature profile. Temperature is the measure of heat in the water and can affect the lake’s chemistry and biology. For example, the amount of oxygen water can hold is directly related to the temperature of the water. The higher the temperature, the less dissolved oxygen the water can hold. Oxygen will naturally decline during the summer months as water temperatures rise. Lakes deeper than 25-30 feet can also stratify, with warm water above cooler deep water, restricting circulation in the lake. This can contribute to oxygen loss in the lower waters. Temperature can also control the kinds of plants and animals found in lakes. Certain species of fish, insects and algae will predominate during the cooler temperatures of the spring and fall, yet disappear during the warmer temperatures of summer. For instance, salmonid fish (such as trout and salmon) generally prefer temperatures below 18°C (65°F) but can tolerate slightly higher temperatures for short periods of time. Conversely, other more tolerant species will predominate during the more stressful summer months.
How do we monitor Dissolved Oxygen?
Approximately every two weeks, we record a Dissolved oxygen (DO) profile. DO is a critical indicator of the health of the lake system. DO is produced through photosynthesis, consumed during respiration and decomposition, and is influenced by wind, wave action, weather events, and lake productivity. A good supply of oxygen is essential for fish and other aquatic species. As lakes become more biologically productive in the summer, oxygen can decline as decomposition occurs in deep areas of the lake. Loss of oxygen may indicate a stressed and changing ecosystem. Understanding the pattern and extent of oxygen loss in deep areas is particularly important for lakes that may be more vulnerable for internal phosphorus loading due to unique sediment chemistry.
Total Phosphorus
Phosphorus is the key nutrient driving algae growth in lakes. Because it occurs naturally in very small amounts, phosphorus “limits” the growth of algae in lake ecosystems. Even slight increases in phosphorus can lead to significant increases in algal growth, which hinders not only the overall health of the lake system but also the economic, recreational, and aesthetic values. Tracking phosphorus levels over time helps monitor changes in water quality.
9 ppb
2025
EC minimum
15.25 ppb
2025
EC average
21 ppb
2025
EC maximum
15.77 ppb
Historical EC average
on Androscoggin Lake
12 ppb
Average EC on
Maine Lakes
Epilimnetic core's (EC's) are collected from the top layer of the lake/pond using an integrated core sampler. Generally, in-lake EC Total Phosphorus (TP) concentrations should stay below 10 ppb. Lakes with phosphorus concentrations of ~13 ppb or more are known to sustain algal blooms, and blooms become frequent as average concentrations approach 20 ppb.
31 ppb
2025
BG minimum
31 ppb
2025
BG average
31 ppb
2025
BG maximum
35.71 ppb
Historical BG average
on Androscoggin Lake
Total Phosphorus (TP) samples were collected from the bottom of the lake or pond using a Kemmerer grab sampler; this type of sample is known as a “bottom grab”. Bottom grabs (BG) are collected when anoxia is encountered anywhere in the dissolved oxygen profile, and help us determine if there is active phosphorus release from bottom sediments exposed to anoxic conditions.
Chlorophyll-a (Chl-a)
Chlorophyll is found in plants (including algae) and is used to convert sunlight into energy. Measuring the concentration of Chlorophyll in lake water helps us estimate the algae population in the lake.
4.9 ppb
2025
Chl-a minimum
4.9 ppb
2025
Chl-a average
4.9 ppb
2025
Chl-a maximum
6.69 ppb
Historical Chl-a average
on Hales Pond
12 ppb
Average Chl-a on
Maine Lakes
How do we monitor Phosphorus & Chlorophyll?
Once per month, 30 Mile collects water samples and analyzes them for phosphorus and chlorophyll concentrations. Phosphorus is the nutrient that most influences the growth of algae in lakes. Phosphorus naturally occurs in soil, but is also found in fertilizers, septic systems, and animal or livestock waste, among other sources throughout a watershed. Chlorophyll is a pigment found in plants and algae. Measuring the concentration of this pigment helps us estimate the algal population in the lake.
Advanced Chemistry Parameters
Once per season in August, 30 Mile collects water samples and analyzes them for advanced chemistry parameters.
pH
pH helps determine which plant and animal species can live in the lake, and it governs biochemical processes that take place. The pH scale ranges from 0- 14, with 7 being neutral. Water is increasingly acidic below 7, and increasingly alkaline above 7.
2025 pH: 6.7
Maine Lakes pH average: 6.4
Hales Pond historical pH average: 6.99
True Color
Water color refers to the concentration of natural dissolved organic acids. This includes natural tannins and lignins dissolved in the water, often resulting in "tea" or "root beer" colored water in very colored lakes. “True Color” is measured in Platinum Cobalt Units (PCU) after all particulates (including algae cells) have been filtered out of the sample. Colored lakes (>25 PCU) can naturally have reduced transparency readings and increased phosphorus values. However, this does not mean the lakes produce more algae. The color simply reduces the transparency such that the reading is not a good measure of algal biomass. Chlorophyll-a (Chl-a) is the best indicator of algal productivity in colored lakes and should be used if possible.
2025 color: 37 PCU
Maine Lakes Color average: 20.7 PCU
Hales Pond historical Color average: 48.17 PCU
Conductivity
Conductivity measures the ability of water to carry electrical current and is directly related to the dissolved ions (charged particles) present in the water. Fishery biologists can use conductivity values to calculate fish yield estimates because conductivity will generally increase if there is an increase of pollutants entering the lake or pond. Stormwater runoff from developed areas and roadways is the most common pollutant in Maine lakes that can raise conductivity values. Conductivity is measured in micromhos per centimeter (µMHOS/cm).
2025 conductivity: 74.7 µMHOS/cm
Maine Lakes Conductivity average: 51.1 µMHOS/cm
Hales Pond historical Conductivity average: 72.92 µMHOS/cm
Alkalinity
Alkalinity is also referred to as “buffering capacity.” It is a measure primarily of naturally available bicarbonate, carbonate, and hydroxide ions in the water and is measured in milligrams per liter (mg/L). Measuring alkalinity is important to determining a lake’s ability to neutralize acidic pollution from rainfall or snowmelt. Lakes with alkalinity values >20 mg/L are considered well buffered against pH changes over time. Lakes with low or zero alkalinity may have more variation in pH levels that can sometimes result in damage to aquatic life.
2025 alkalinity: 13 mg/L
Maine Lakes Alkalinity average: 11.7 mg/L
Hales Pond historical Alkalinity average: 11.8 mg/L
How do we monitor Advanced Chemistry Parameters (pH, Alkalinity, True Color, and Conductivity)?
Once per season, in the month of August, 30 Mile collects water samples and analyzes them for advanced chemistry parameters.
pH: pH affects the types of plant and animal species that can live in the lake and governs biochemical processes that take place. The pH scale ranges from 0-14, with 7 being neutral. Water is increasingly acidic below 7, and increasingly alkaline above 7. A one unit change in pH represents a tenfold change in acidity or alkalinity. The pH scale is the inverse log of the hydrogen ion concentration.
Alkalinity: Alkalinity is also referred to as “buffering capacity.” It is a measure primarily of naturally available bicarbonate, carbonate, and hydroxide ions in the water and is measured in milligrams per liter (mg/L). Measuring alkalinity is important to determining a lake’s ability to neutralize acidic pollution from rainfall or snowmelt. Lakes with alkalinity values >20 mg/L are considered well buffered against pH changes over time. Lakes with low or zero alkalinity may have more variation in pH levels that can sometimes result in damage to aquatic life.
True Color: Water color refers to the concentration of natural dissolved organic acids. This includes natural tannins and lignins dissolved in the water, often resulting in “tea” or “root beer” colored water in very colored lakes. “True Color” is measured in Platinum Cobalt Units (PCU) after all particulates (including algae cells) have been filtered out of the sample. Colored lakes (>30 PCU) can naturally have reduced transparency readings and increased phosphorus values. However, this does not mean the lakes produce more algae. The color simply reduces the transparency such that the reading is not a good measure of algal biomass. In this case, chlorophyll-a (Chl-a) is the best indicator of algal productivity.
Conductivity: Conductivity measures the ability of water to carry an electrical current and is directly related to the dissolved ions (charged particles) present in water. Fishery biologists can use conductivity values to calculate fish yield estimates because conductivity will increase if there is an increase of pollutants entering a lake or pond. Stormwater runoff from developed areas and roadways is the most common pollutant in Maine lakes that can raise conductivity values. Conductivity is measured in micromhos per centimeter (µMHOS/CM).
Discussion & Next Steps
Lorem ipsum dolor sit amet consectetur adipiscing elit. Quisque faucibus ex sapien vitae pellentesque sem placerat. In id cursus mi pretium tellus duis convallis. Tempus leo eu aenean sed diam urna tempor. Pulvinar vivamus fringilla lacus nec metus bibendum egestas. Iaculis massa nisl malesuada lacinia integer nunc posuere. Ut hendrerit semper vel class aptent taciti sociosqu. Ad litora torquent per conubia nostra inceptos himenaeos.
Lorem ipsum dolor sit amet consectetur adipiscing elit. Quisque faucibus ex sapien vitae pellentesque sem placerat. In id cursus mi pretium tellus duis convallis. Tempus leo eu aenean sed diam urna tempor. Pulvinar vivamus fringilla lacus nec metus bibendum egestas. Iaculis massa nisl malesuada lacinia integer nunc posuere. Ut hendrerit semper vel class aptent taciti sociosqu. Ad litora torquent per conubia nostra inceptos himenaeos.
Next Steps
- Your content goes here. Edit or remove this text inline or in the module Content settings. You can also style every aspect of this content in the module Design settings and even apply custom CSS to this text in the module Advanced settings.
- Your content goes here. Edit or remove this text inline or in the module Content settings. You can also style every aspect of this content in the module Design settings and even apply custom CSS to this text in the module Advanced settings.
- Your content goes here. Edit or remove this text inline or in the module Content settings. You can also style every aspect of this content in the module Design settings and even apply custom CSS to this text in the module Advanced settings.
What can I do to help protect Hales Pond?

Sign up to Volunteer
Monitoring is conducted May-September. Volunteers work alongside our staff, in a canoe or motor boat, assisting in data collection.
Request a LakeSmart Visit
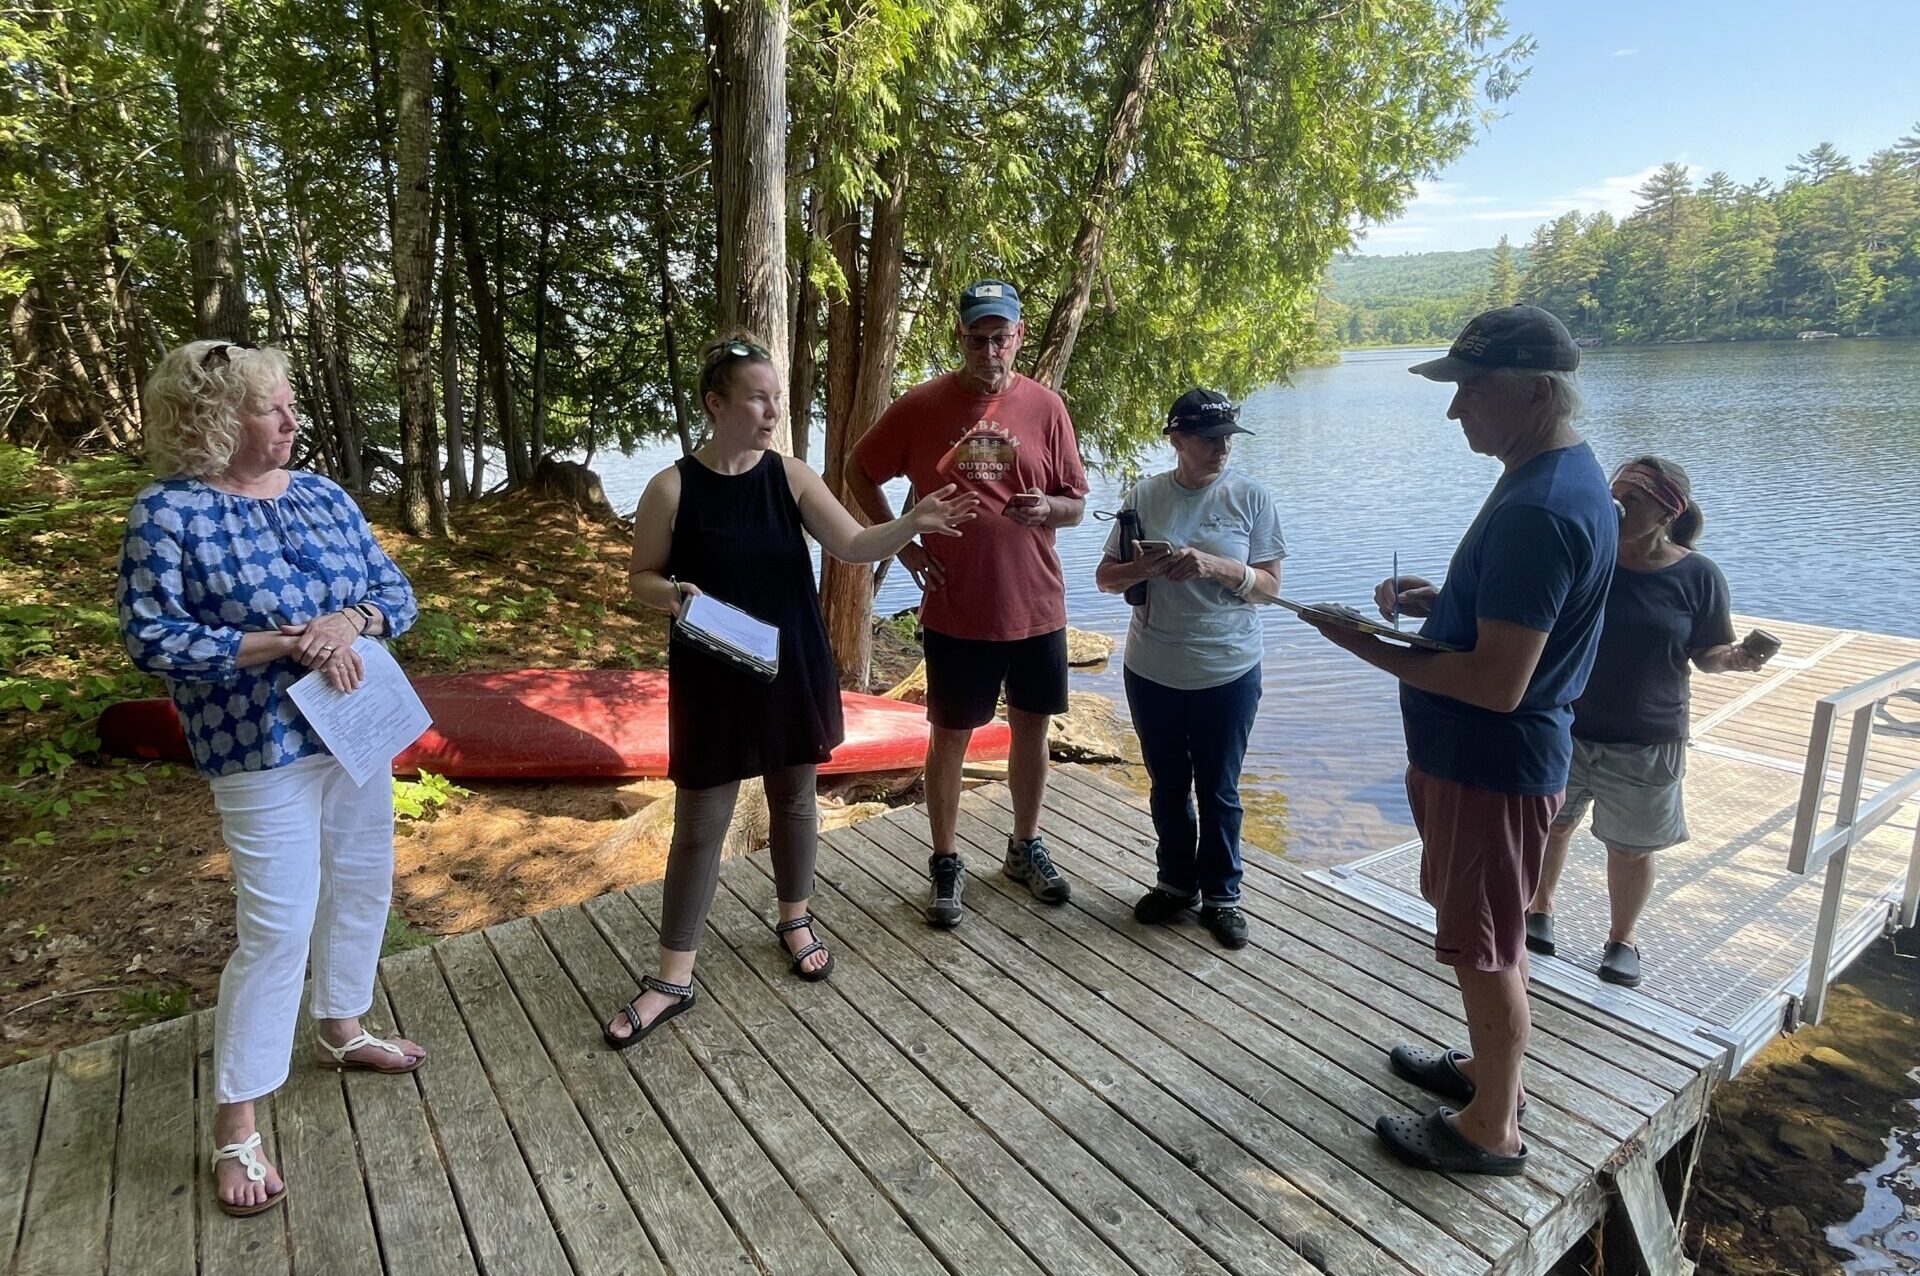
LakeSmart helps lakefront homeowners manage landscapes in ways that protect water quality. It is free, non-regulatory, and voluntary.
Support 30 Mile
It takes a community to protect our precious lakes. Support our work for clean and healthy lakes, ponds, and streams in our watershed.